Preprint on “Visual Network Exploration for Data Journalists”, Routledge Handbook of Developments in Digital Journalism Studies
October 19, 2017
We’ve recently uploaded a new preprint for a book chapter on “Visual Network Exploration for Data Journalists”, which is to be published in the forthcoming Routledge Handbook to Developments in Digital Journalism Studies (Abingdon: Routledge, 2018) edited by Scott Eldridge II and Bob Franklin.
This is part of a series of collaborations with Tommaso Venturini, Mathieu Jacomy, Liliana Bounegru and other colleagues at the Public Data Lab on papers and projects studying and experimenting with networks in different fields, including data journalism, digital methods, digital sociology and associated areas. This includes looking at how people use networks to tell stories or undertake different “styles of reasoning” and analysis. We’re also very interested in interdisciplinary encounters drawing on different cultures and practices of “doing things with networks”.
So far we’ve got several pieces published and in the pipeline, including “Narrating Networks: Exploring the Affordances of Networks as Storytelling Devices in Journalism” and “How to Tell Stories with Networks: Exploring the Narrative Affordances of Graphs with the Iliad”.
The abstract for the preprint on “Visual Network Exploration for Data Journalists” is copied below.
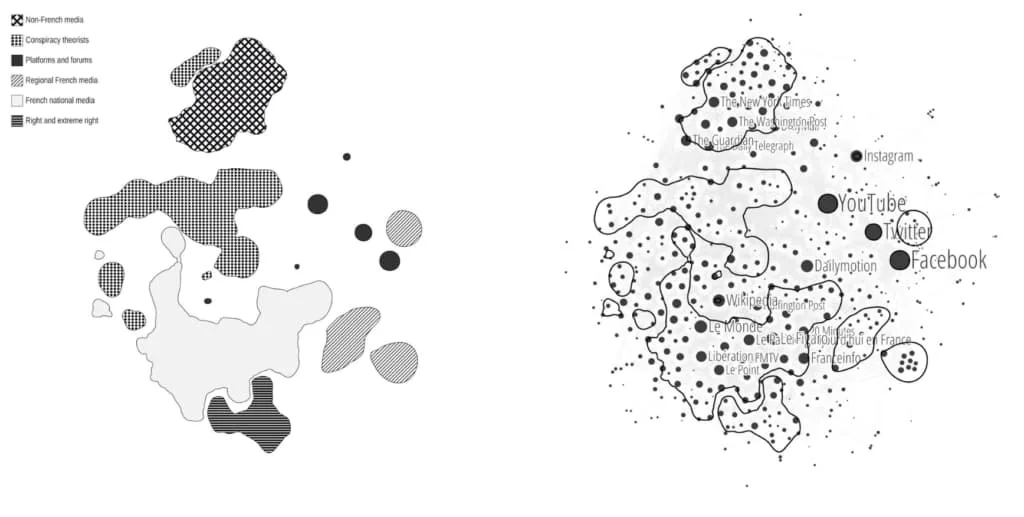
Networks are classic but under-acknowledged figures of journalistic storytelling. Who is connected to whom and by which means? Which organizations receive support from which others? What resources or information circulate through which channels and which intermediaries enable and regulate their flows? These are all customary stories and lines of inquiry in journalism and they all have to do with networks. Additionally, the recent spread of digital media has increasingly confronted journalists with information coming not only in the traditional form of statistic tables, but also of relational databases. Yet, journalists have so far made little use of the analytical resources offered by networks. To address this problem in this chapter we examine how “visual network exploration” may be brought to bear in the context of data journalism in order to explore, narrate and make sense of large and complex relational datasets. We borrow the more familiar vocabulary of geographical maps to show how key graphical variables such as position, size and hue can be used to interpret and characterise graph structures and properties. We illustrate this technique by taking as a starting point a recent example from journalism, namely a catalogue of French information sources compiled by Le Monde’s The Decodex. We establish that good visual exploration of networks is an iterative process where practices to demarcate categories and territories are entangled and mutually constitutive. To enrich investigation we suggest ways in which the insights of the visual exploration of networks can be supplemented with simple calculations and statistics of distributions of nodes and links across the network. We conclude with reflection on the knowledge-making capacities of this technique and how these compare to the insights and instruments that journalists have used in the Decodex project – suggesting that visual network exploration is a fertile area for further exploration and collaborations between data journalists and digital researchers.