Picturing processes
December 07, 2011
There has been lots of wonderful work to represent numbers in pictorial form. Pictures can help to show us how big things are, how much of something there is, how much one thing is compared to another, how amounts change over time, and so on. We can use interactive graphics to represent quantitative data on everything from the credit crisis, to emissions reduction targets, to public expenditure, to vital statistics on international development.
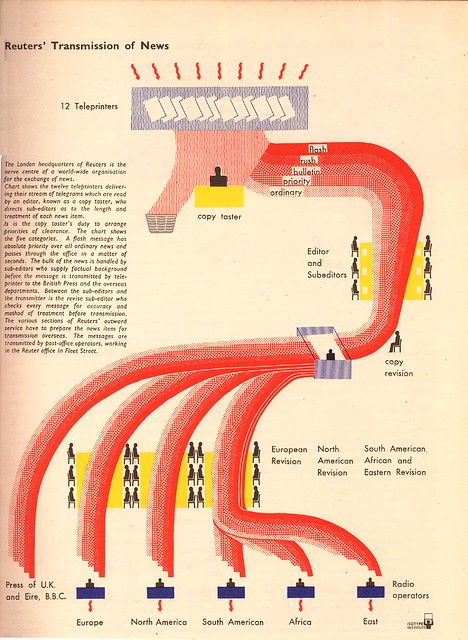
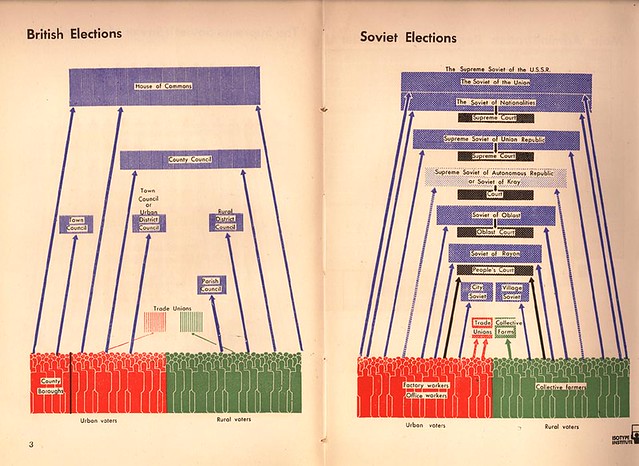
But how can we use pictures to represent processes? Otto and Marie Neurath’s Isotype Institute from the 1940s was interested in using pictures to represent processes as well as numbers. For example, here’s one showing how Reuters’ news editorial process works:
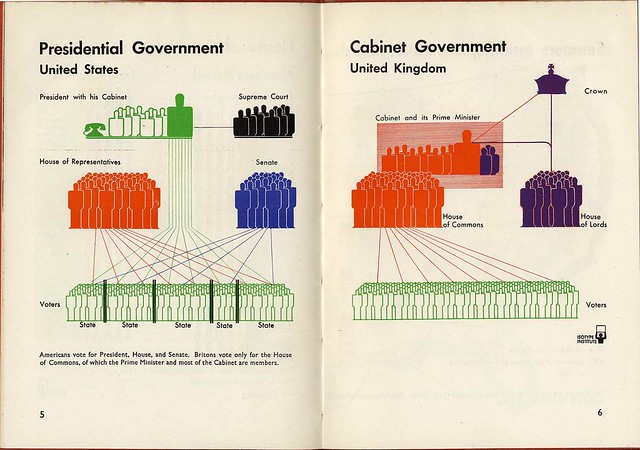
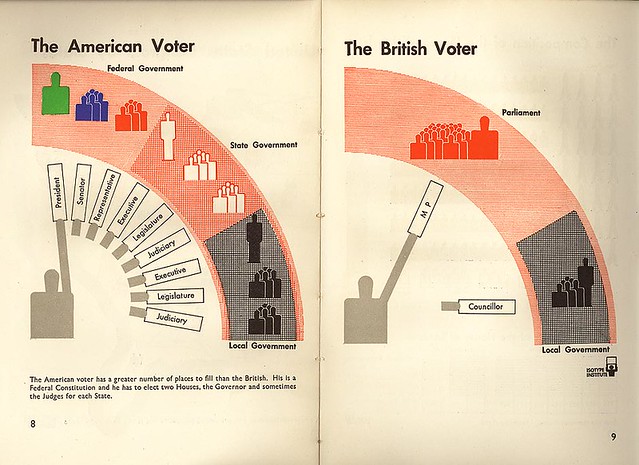
Here’s a few more which aim to compare various aspects of political systems in different countries:
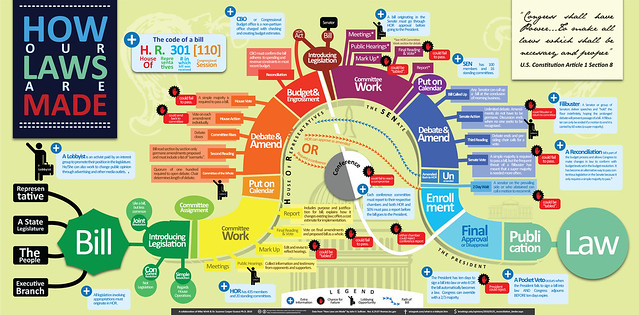
Here’s another much more recent example showing how laws are passed in the US, which was a winner of the Sunlight Labs Design for America competition:
I’d love to see more information graphics that helped people to understand official processes. For example:
- Local decision making
- How lobbying works
- How elections work – from ballot box to outcome
- Legal processes in particular areas – e.g. immigration
- International organisations – e.g. the UN security council
- Public finance – from taxation to budgeting to expenditure
- Public procurement
One could imagine that graphical representations of an official process could have common elements that could be used to represent similar processes in other countries – for example icons to represent voters, lobbyists, political representatives, laws, decisions, revisions, budgets, and so on.
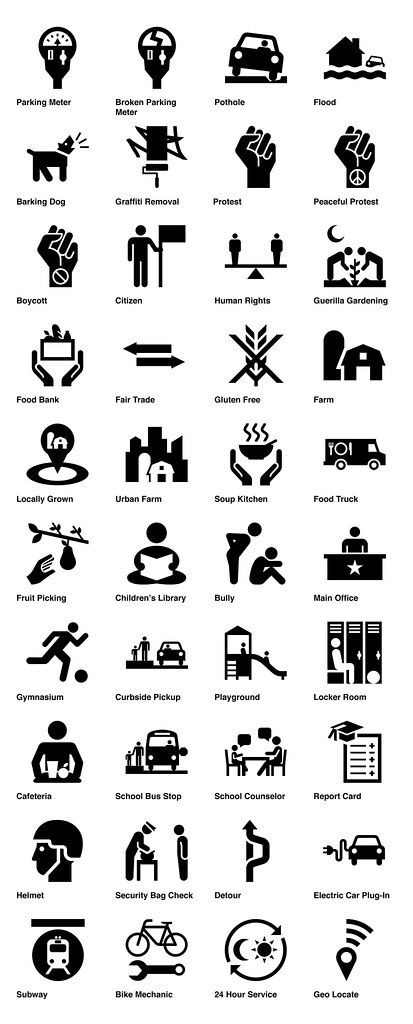
One could do something like the Noun Project‘s Iconathon aimed at building a set of icons to help to represent official processes. The Iconathon 2011 produced a suite of collaboratively designed new civic symbols which anyone is free to use:
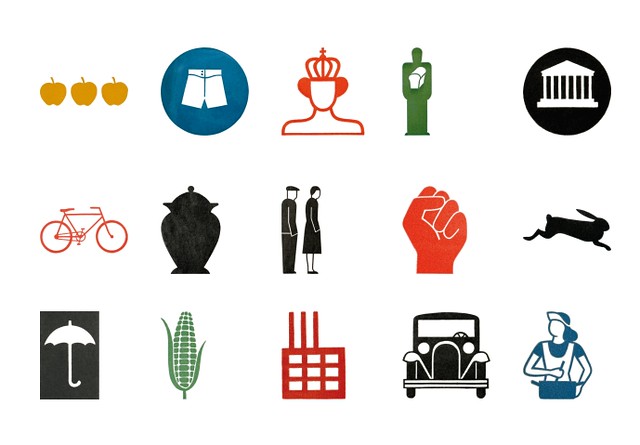
I’m sure Marie and Otto Neurath, who pioneered the Isotype picture language (International System of TYpographic Picture Education) would approve. For comparison, here are some of the Isotype designs created by Gerd Arntz, who produced over 4000 symbols for the Isotype picture language: